Introduction
Income inequality is a critical challenge in India’s economic landscape. Despite rapid growth, the distribution of wealth and income remains highly uneven. One of the most common ways to measure this inequality is through the Gini Index.
In this article, we will explore:
- What the Gini Index is
- India’s Gini Index trends
- Causes of income inequality
- Global comparisons
- Impact on society
- Solutions and policy recommendations
What Is the Gini Index?
The Gini Index, also known as the Gini Coefficient, is a statistical measure of income distribution. It ranges between:
- 0 (perfect equality) – everyone earns the same
- 1 (perfect inequality) – one person earns everything, others earn nothing
For easier understanding, it’s often represented on a scale of 0 to 100 (just multiply the coefficient by 100).
| Gini Score (0–1) | Interpretation |
|---|---|
| 0.20 – 0.29 | Low inequality |
| 0.30 – 0.39 | Moderate inequality |
| 0.40 – 0.49 | High inequality |
| 0.50+ | Very high inequality |
India’s Gini Index Over the Years
India’s Gini Index has shown a worrying trend over the decades. Let’s look at historical data.
🧮 Table: Gini Index of India (1970–2025)
| Year | Gini Index (Income) | Gini Index (Wealth) | Notes |
|---|---|---|---|
| 1970 | 0.34 | 0.58 | Post-Green Revolution era |
| 1991 | 0.36 | 0.61 | Economic liberalization starts |
| 2000 | 0.37 | 0.65 | Rapid urban growth |
| 2010 | 0.38 | 0.70 | IT boom, urban-rural divide widens |
| 2020 | 0.41 | 0.74 | COVID-19 worsens inequality |
| 2025* | 0.43 (estimated) | 0.76 (estimated) | Based on recent IMF and NSSO data |
Sources: World Bank, IMF, NSSO, Oxfam India, Credit Suisse Global Wealth Report
Causes of Income Inequality in India
Income inequality in India is the result of a complex mix of structural, historical, and policy-driven factors.
1. Urban-Rural Divide
- Urban areas contribute over 60% of GDP but house only 30% of the population.
- Rural wages are lower and more seasonal.
2. Educational Disparities
- Quality of education varies dramatically between private and government schools.
- Access to higher education remains unequal.
3. Job Market Polarization
- High-paying jobs are concentrated in technology and finance sectors.
- Majority of Indians work in informal and low-wage jobs.
4. Caste and Gender Discrimination
- Historical oppression and lack of access for marginalized communities persist.
- Women still earn 20–30% less than men for similar work.
5. Wealth Concentration
According to Oxfam:
- Top 1% of Indians own more than 40% of the country’s wealth.
- Bottom 50% own just 3%.
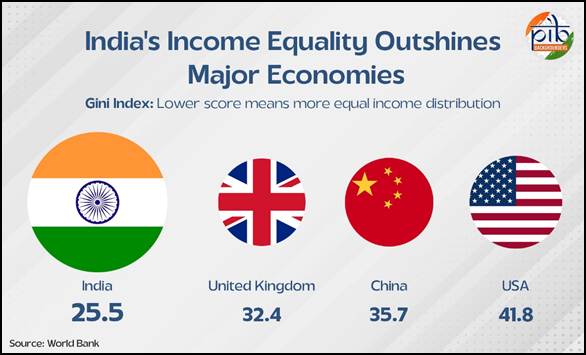
Comparison: India vs Other Countries
🌍 Table: Gini Index Comparison (2024)
| Country | Gini Index (Income) | Inequality Level |
|---|---|---|
| India | 0.43 (2025 est.) | High |
| China | 0.46 | Very High |
| USA | 0.41 | High |
| Germany | 0.29 | Moderate |
| Norway | 0.25 | Low |
| Brazil | 0.53 | Very High |
| South Africa | 0.63 | Extreme inequality |
India ranks among the most unequal economies in Asia.
Effects of Income Inequality
1. Social Unrest
- High inequality often leads to protests and dissatisfaction among youth.
- Increases the risk of violence and political instability.
2. Low Human Development
- Regions with high inequality score low in health and education metrics.
- Access to basic services is uneven.
3. Economic Drag
- Concentration of wealth reduces overall consumption.
- Small businesses and rural markets suffer from weak demand.
4. Brain Drain
- Talented youth from poor backgrounds often seek opportunities abroad.
- Domestic talent remains underutilized.
India’s Income Inequality: Richest vs Poorest
📊 Table: Wealth Share by Population Group (2024)
| Population Group | % of Wealth Owned |
|---|---|
| Top 1% | 40.1% |
| Top 10% | 73.6% |
| Bottom 50% | 3% |
| Middle 40% | 23.4% |
Source: Oxfam India, Credit Suisse 2024 Report
Government Policies to Address Inequality
India has taken steps to reduce inequality, though with limited success.
✅ Successful Interventions
- MNREGA: Rural employment guarantee scheme.
- PM-KISAN: Direct cash transfers to farmers.
- Subsidized LPG, food, and health services.
⚠️ Challenges
- Leakages and corruption in welfare schemes.
- Underfunding of education and health sectors.
- Lack of progressive taxation on wealth and inheritance.
Role of Taxation and Wealth Redistribution
India’s direct tax base is narrow, and most revenue comes from indirect taxes like GST which affect the poor more.
| Tax Type | Share in Total Revenue (2023) |
|---|---|
| Income Tax | 22% |
| Corporate Tax | 24% |
| GST | 28% |
| Excise & Others | 26% |
Only 1.4% of Indians file income tax. A wealth tax or inheritance tax is still not implemented, unlike in developed nations.
Solutions to Reduce Income Inequality
Here are some expert-backed solutions:
1. Invest in Education & Healthcare
- Universal access to quality public services reduces long-term inequality.
2. Progressive Taxation
- Higher taxes on luxury goods, inheritance, and capital gains.
3. Support MSMEs
- Small businesses employ millions and can reduce job disparity if supported.
4. Land and Property Reforms
- Address rural poverty through better land rights and infrastructure.
5. Empower Women and Minorities
- Equal pay, skill training, and representation policies.
Gini Index Criticism and Limitations
While useful, the Gini Index has limitations:
- Does not reflect absolute poverty.
- Can be the same for countries with different income profiles.
- Wealth inequality is not well captured unless separate index is used.
For a more holistic view, tools like the Palma Ratio and Theil Index are also used.
The Road Ahead for India
India is at a crossroads. With its massive demographic dividend, if inequality is not addressed now, the consequences may be dire:
- A frustrated youth population
- Sluggish economy due to weak demand
- Increasing crime and instability
On the positive side, India’s tech and digital infrastructure offers a chance to leapfrog traditional challenges if investments are inclusive.
Conclusion
Income inequality, as reflected in the Gini Index, is a serious challenge for India. While the country has made strides in economic growth, the benefits haven’t been distributed equitably. Unless strategic reforms are adopted — especially in education, taxation, and social security — inequality will continue to widen.
Key Takeaways:
- India’s Gini Index is estimated to be 0.43 in 2025, indicating high inequality.
- Top 1% hold over 40% of wealth.
- Inclusive growth and policy reforms are essential to address the imbalance.